Mars Global Surveyor

Thermal Emission Spectrometer (TES) instrument

Water Ice Clouds Imaged by TES 

The TES instrument has identified water-ice clouds using the infrared spectral signature of ice. These clouds are warmer than the surface at night and cooler during the day. This set of four images shows the occurence of clouds over the Tharsis volcanic region, which includes Olympus Mons and three other large volcanoes. This area is the cloudiest region that TES has observed. In addition, the TES has discovered that clouds cover this region at night, in addition to those that are often observed in visible images. The variations in water-ice cloud occurrence will provide important clues to the temperature and dynamics of the Martian atmosphere, as well as clues to the transport of water between the surface, atmosphere, and poles. 

The four images below were acquired on four separate orbits (17, 24, 31, and 22, from left to right) as the MGS spacecraft approached the planet. Clouds over the Tharsis region are clearly evident as the planet rotates. 


Pyroxene Abundance as Measured by TES 

The TES instrument has begun mapping the spatial distribution of minerals on the surface of Mars. This is the first time that mineral abundance has been mapped in fine detail on Mars. The classic dark region of Syrtis Major is covered by a significant amount of the mineral pyroxene. Pyroxene is a common igneous mineral, and its occurrence is consistent with previous observations. 

The figure shows the Syrtis Major region of Mars. The image is rotated 90 degrees, such that north is to the right. The dark green track across the image is the spacecraft track over the surface, acquired during orbit 34, on 5 November 1997. The graph at the bottom of the image shows the relative abundance of pyroxene along the spacecraft ground track. Dark sandy regions contain the greatest amounts of pyroxene, while the bright regions appear to have less. 


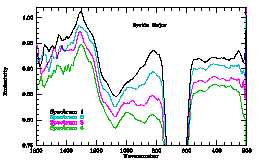
These spectra demonstrate the variability in pyroxene abundance across the Syrtis Major region. Spectrum 1 is low in pyroxene (see green graphic above), while spectra 2 and 3 exhibit a deepening of the spectral feature around 900 wavenumbers, and spectrum 4 shows the deepest pyroxene feature. (Spectra are offset for visibility.) 


Atmospheric Temperatures over Pathfinder Landing Site as Measured by TES 

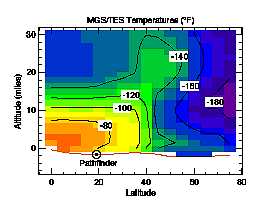
Early morning atmospheric temperatures have been retrieved from TES spectra over a portion of the northern hemisphere including the Pathfinder lander site. The warmest temperatures of about -65 degrees Fahrenheit are observed near the surface and equator. The temperature observed near the surface at the Pathfinder lander site is about -85 degrees F, which is similar to that observed by Pathfinder. Temperatures near the north pole dip to below -180 F. On Earth, the lowest temperature ever recorded in the Antarctic is about -120 F, the temperature at the tropopause (an altitude of 9 miles) is about -70 F, and the temperature at a pressure level of 6 mbar (equal to that near the Mars surface) is about -20 F. As the air becomes dustier, it becomes warmer; thus the atmospheric temperatures surve as a monitor of dustiness. The plume of warm air north of Pathfinder is correlated with high winds measured by the TES. TES will continually observe the atmosphere, both to determine the weather, and to search for dust storms. 


TES Temperature Measurements of the South Polar Cap of Mars 

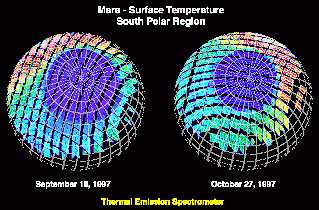
The TES has been monitoring changes in the south polar ice cap during the spring season. During this time, the cap has been shrinking as the sun warms the surface and sublimates the CO2 ice. The cap location is easily detected using surface temperature measurements because CO2 ice has a temperature near -190 F, while the ice-free surface is 20-30 degrees warmer. The cap was approximately 2,600 miles in diameter on 19 September, and has shrunk by over 600 miles during the past two months. The MGS polar orbit provides the first opportunity to observe the polar caps of Mars on a daily basis. Throughout the aerobraking phase of the mission, a temperature image of the cap will be collected on each orbit, allowing the retreat of the cap edge to be tracked in spectacular detail. Variations in the retreat of the polar cap from year to year will provide insight into yearly changes in the martian climate. 

This figure shows the 25 micron temperature of the martian southern hemisphere as measured by the TES during orbits 5 (19 September 1997) and 29 (27 October 1997). The dark violet regions are the coldest, and the red-pink regions are the warmest. In September, the cap was approximately 3000 miles in diameter, roughly the size of the United States. By October, a significant decrease in the extent of the polar cap is observed, concurrent with the onset of summer in the southern hemisphere. 


TES Spectra of Mars 

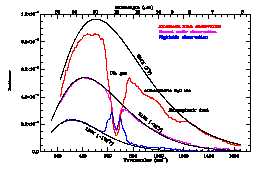
This picture shows spectra of Mars acquired by the TES instrument during orbit P6. The three spectra show the effects of varied amounts of solar illumination. The black curves are the energy that you would see if there were no materials present to absorb energy (e.g., atmospheric gases, surface rocks). The curves exhibit different amounts of total energy (or radiance, on the vertical axis) at different temperatures. 

The lowermost curve is very cold because it is an observation of Mars' nightside. The large absorption at 15 microns (in all three spectra) is due to the CO2 atmosphere of Mars, and it rises above the majority of the curve in this spectrum because the atmosphere is actually warmer than the surface underneath. The center of the atmospheric band drops back down in radiance because the top of the atmosphere gets cold again as it becomes thinner and is nearer to space. 

The center spectrum is taken at a place where local time is sunset, or on the terminator. The terminator is the dividing line between day and night. As you might expect, this place is warmer than the location on the nightside, and the atmosphere is colder than the surface. 

The upper curve represents a location that is on the dayside of Mars, where temperatures are the warmest. This spectrum was taken at an angle looking obliquely through the atmosphere of the planet, not downward at the surface (nadir). Shallow, broad absorptions in the 8-12 micron region are the result of atmospheric dust and water ice clouds. 


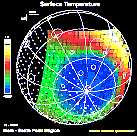
TES Surface Temperature Image 

This image shows the temperature of the martian surface measured by the Mars Global Surveyor Thermal Emission Spectrometer (TES) instrument. On September 15, 3 hours and 48 minutes after the spacecraft's third close approach to the planet, the TES instrument was commanded to point at Mars and measure the temperature of the surface during a four minute scan. At this time MGS was approximately 15,000 miles (~24,000 km) from the planet, with a view looking up from beneath the planet at the south polar region. The circular blue region (-198 F) is the south polar cap of Mars that is composed of CO2 ice. The night side of the planet, shown with crosses, is generally cool (green). The sunlit side of the planet reaches temperatures near 15 F (yellow). Each square represents an individual observation acquired in 2 seconds with a ground resolution of ~125 miles (~200 km). The TES instrument will remain on and collect similar images every 100 minutes to monitor the temperature of the surface and atmosphere throughout the aerobraking phase of the MGS mission.